How to debug using the Agent Handler Dashboard
Last updated: February 26, 2026
Overview
Welcome to the Agent Handler debugging guide — your step-by-step resource for understanding how to troubleshoot and resolve issues with your Agent Handler setup. This guide will help you efficiently debug tool call failures, authentication problems, and configuration issues so your agents can interact with third-party tools reliably.
Key concepts to know
Registered Users
An identity that holds connector credentials. Can be Human or System (bot). Organized by Company, with optional Grouping (department, team, project). Each has a customer-defined Origin ID.
Connectors
An integration with a third-party platform, composed of authentication (OAuth, API key, Personal Access Token) and tools (the actions it can perform).
Tool Packs
A bundle of connectors and tools that an agent can access. Your primary access-control lever.
Tools vs underlying API calls: A single tool call can trigger multiple underlying third-party API requests.
Credentials
Authentication tokens or secrets scoped at two levels:
Organization-level (Shared): One set of credentials across all Registered Users. Common for bot setups.
Individual-level: Credentials tied to a specific Registered User. Common for end-user auth flows.
Identifying and debugging issues
Issues with Agent Handler generally fall into three categories:
1. Authentication/OAuth issues (most common)
These occur when credentials are missing, expired, misconfigured, or lack the required permissions.
Symptoms:
Tool calls return
401 Unauthorizedor403 Forbiddenerrors"Authentication failed" or "Invalid credentials" in tool output
Connector works for some tools but not others (often a scopes/permissions issue)
What to check:
Does the Registered User have valid credentials for the connector?
Is the correct authentication method being used (PAT vs OAuth vs API key)?
If using OAuth, was the correct callback URL configured?
Do the token's scopes and permissions allow the requested operation? (e.g., write operations may require additional scopes)
For connectors that require a site URL (e.g., Jira, Confluence), was the correct URL entered during authentication?
2. Tool call issues
These occur when a tool call executes but produces an unexpected result or error from the third-party API.
Symptoms:
Tool call returns an error from the third-party platform
Tool call succeeds but returns unexpected or incomplete data
Agent references a field that doesn't exist or uses an incorrect value
What to check:
Review the tool call input arguments — are the correct fields and values being passed?
Review the tool call output — what error message or response code did the third-party return?
Review the underlying API request(s) in the logs to see exactly what was sent to and received from the third-party
If the agent is generating invalid fields or arguments, this may be an LLM hallucination issue. Error messages typically help agents self-correct on retry.
If the issue is reproducible with the same inputs and clearly incorrect, it may be a tool implementation issue — escalate to Merge Support.
3. Dashboard/app issues
These are UI or functional issues within the Agent Handler dashboard itself.
Symptoms:
Filters or search not working as expected
Pagination issues when browsing Tool Packs or Registered Users
Unexpected behavior in the Playground
What to do:
Try refreshing the page or clearing your browser cache.
If the issue persists, report it to Merge Support with a screenshot and description.
How to access and interpret Logs
Logs are your most important debugging tool. They provide a detailed record of every tool call, including what was sent, what was received, and the underlying third-party API interactions.
Accessing Logs
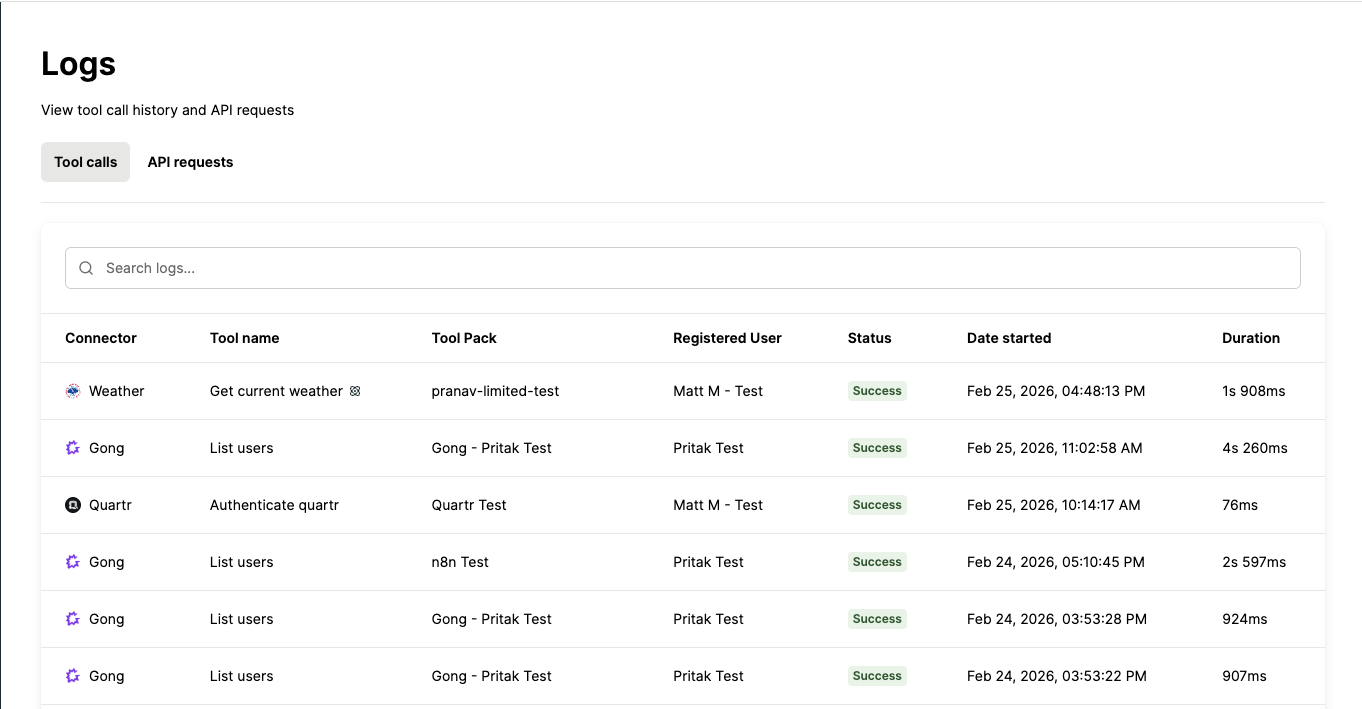
Navigate to the Logs page in the Agent Handler dashboard. Here you'll find a page for tool calls and another page for the API requests that are made during a tool call.
What Logs show
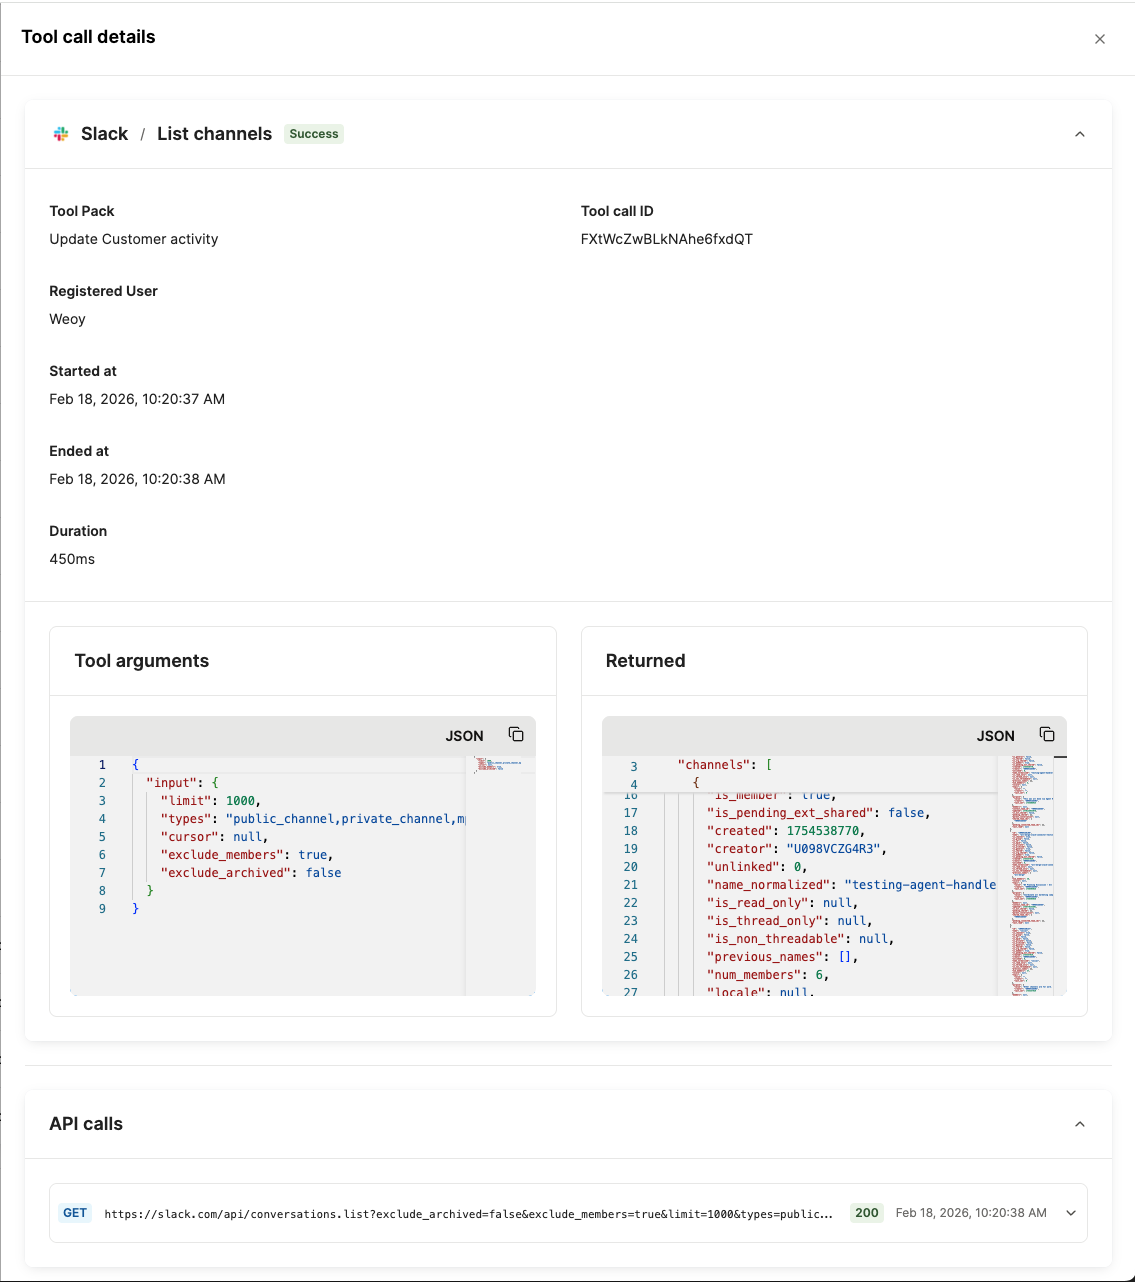
Each log entry in the Tools calls page includes:
Tool name: Which tool was called (and if it's the expected one)
Input payload: The arguments passed to the tool
Output payload: The response returned by the tool, including any error messages
Underlying API requests: The actual HTTP requests made to the third-party platform during the tool call, including request/response bodies and status codes
A single tool call can result in multiple underlying third-party API requests. For example, a
salesforce_get_leadstool call might make 2–3 API requests under the hood to fetch and assemble the data. This is expected behavior. When reviewing logs, don't assume multiple API requests indicate a problem — check whether the final tool output returned the expected result.
Timestamp: When the tool call occurred
Note: Logs do not capture the original user prompt sent to the agent. This is by design for security reasons. Only tool call attempts and their results are logged.
Searching and filtering Logs
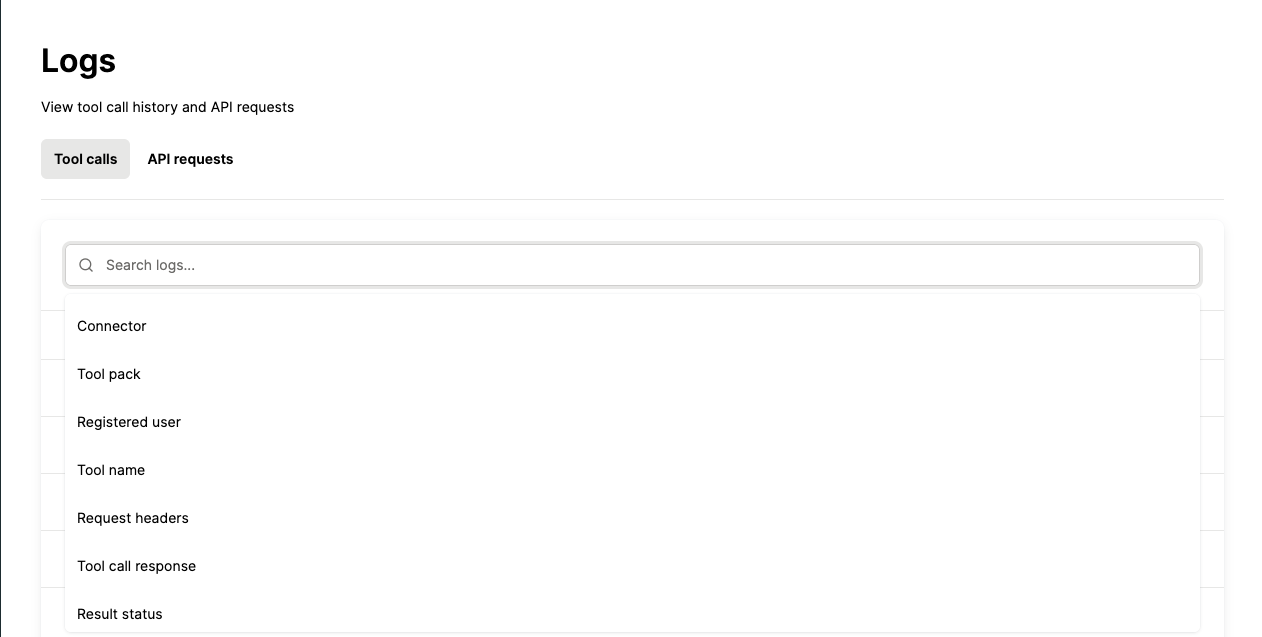
Use filters to narrow down tool calls:
Registered User ID: Trace all tool calls from a specific user
Tool name: Filter by a specific tool
Status: Filter by success or failure
Date range: Focus on a specific time window
Tips for finding relevant Logs
Start with the Registered User ID of the affected user — this is the fastest way to find relevant tool calls.
Look for failed tool calls first, then examine their input/output payloads.
Check the underlying API requests to determine if the error originated from the third-party platform or from the tool implementation.
The LLM may retry and self-correct after a failure, so you may see multiple attempts for the same action. Review them in chronological order.
Common status codes within Logs
Agent Handler tool calls surface standard HTTP status codes from the underlying third-party API requests:
Successful status codes
Code | Meaning |
200 | Success |
201 | Successfully created data (write operations) |
Common error codes
Code | Issue | Description | Troubleshooting tips |
400 | Bad Request | The third-party API rejected the request due to invalid parameters or missing required fields. | Review the tool input arguments and the third-party's error message. Check if required fields are being passed correctly. |
401 | Unauthorized | Authentication credentials are missing, expired, or invalid. | Verify the Registered User's credentials. Re-authenticate if needed. Ensure the correct auth method is being used. |
403 | Forbidden | The authenticated user lacks permissions to perform the requested action. | Check that the token's scopes and permissions include the required operation. Review the third-party platform's permission requirements. |
404 | Not Found | The requested resource does not exist, or the endpoint is not supported. | Verify IDs and parameters in the tool input. Check if the resource exists in the third-party platform. |
429 | Too Many Requests | Rate limit reached on the third-party API. | The agent may automatically retry after a delay. If persistent, review call frequency and consider reducing the number of tool calls. |
500 | Internal Server Error | An unexpected error occurred. | Retry the tool call. If the issue persists, escalate to Merge Support with relevant log details. |
502/503 | Service Interruption | The third-party platform may be experiencing an outage. | Check the third-party platform's status page for known outages. |
Using the Playground for testing
The Playground lets you interactively test tool calls to verify your setup in real time and reproduce issues.
How to use the Playground
Navigate to Playground in the Agent Handler dashboard.
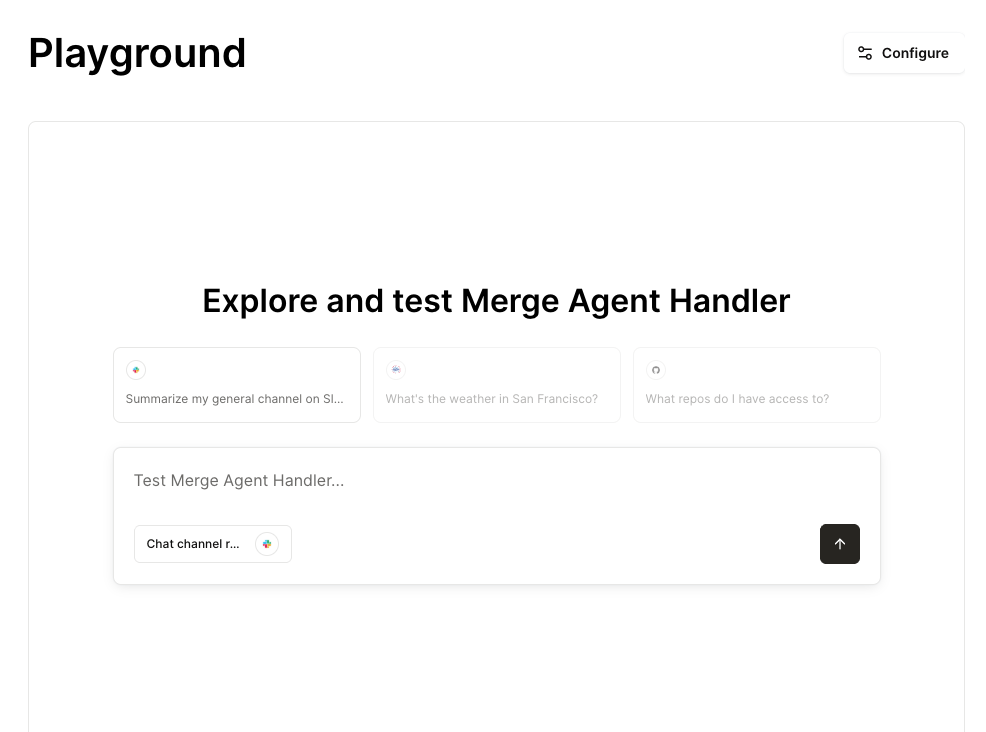
Select your Registered User and Tool Pack.
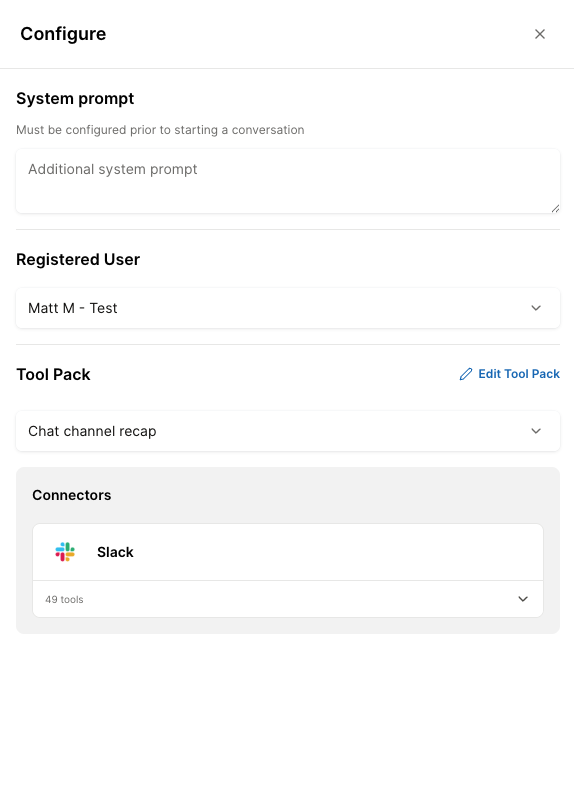
Enter a natural language prompt or select a specific tool to call.
Review the tool call result, including inputs, outputs, and status.
When to use the Playground
Verifying setup: Confirm that a connector, credentials, and tool pack are working end-to-end.
Reproducing issues: Replicate a reported problem in a controlled environment.
Testing new tools: Validate tool behavior before enabling it in production.
Tip: If you cannot find your Tool Pack or Registered User in the Playground dropdowns, try selecting any existing Tool Pack that includes the relevant connector to continue testing.
Troubleshooting tips and guidance
Where to look first
When an issue is reported, the goal is to identify whether the problem originates from:
The third-party platform (e.g., Salesforce, Jira, HubSpot)
Agent Handler / Merge's platform
Your application or agent implementation
The data flow for a tool call is: Your agent → Agent Handler → Third-party platform → Agent Handler → Your agent
By reviewing tool call logs and the underlying API requests, you can trace where in this flow the issue occurs.
Example troubleshooting process
Let's say an end user reports that creating a Jira issue through your agent is failing:
Get the Registered User ID for the affected user.
Navigate to Logs and filter by that Registered User ID.
Find the failed tool call (e.g.,
jira_create_issue) and open it.Review the input payload: Are all required fields present and correctly formatted?
Review the output payload: What error message was returned?
Check the underlying API request: What did the third-party actually receive, and what was their response?
Analyze the results:
If the third-party returned a
403 Forbidden, the user may lack permissions in Jira to create issues in that project → credential/permission issue.If the third-party returned a
400 Bad Requestwith a message about a missing required field, the agent may not be passing all required fields → check the tool's input schema and the agent's prompt.If the tool input looks correct but the underlying API request has different or missing data, this may be a tool implementation issue → escalate to Merge Support.
Additional tips
Familiarize yourself with the dashboard before critical support moments. Browse Logs, Tool Packs, and Registered Users to build comfort.
Keep Tool Packs small and scoped to reduce LLM confusion and improve tool call accuracy.
Error messages help agents self-correct. If a tool call fails, the LLM will often retry with corrected inputs automatically.
Check the third-party platform's status page if you're seeing widespread
502/503errors.
Steps for escalating an issue to Merge
If you are unable to resolve an issue after reviewing logs and troubleshooting, escalate using one of the following methods:
Slack: Reach out on your designated Merge support Slack channel
Email: Contact support@merge.dev, copying relevant stakeholders if necessary
Your message should include:
Registered User ID (and Origin ID if relevant)
Tool Pack name and which tools are enabled
Connector and specific tool involved
What operation was attempted and what was expected
Exact error message from the tool output
Links to relevant logs and timestamps
Steps to reproduce the issue
Any steps you've already taken to try to resolve it
The Agent Handler dashboard offers powerful tools to manage and debug your agent's integrations. By following the steps outlined in this guide, you can quickly diagnose and resolve problems with tool calls, authentication, and configuration. If needed, escalate issues to Merge Support for further assistance.